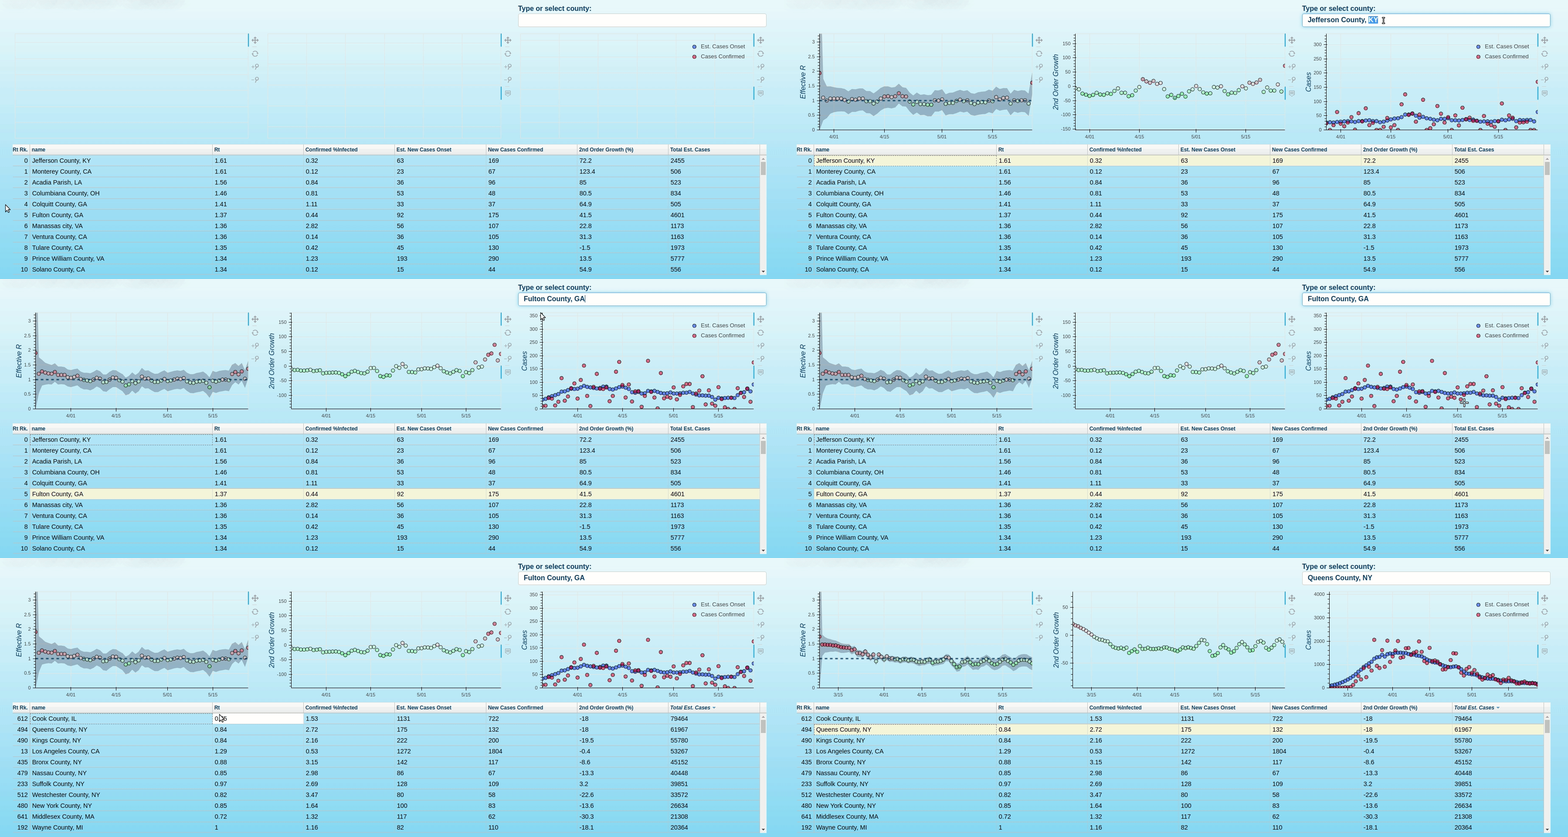
- A “real-time”1 county-level dashboard w/ a focus on estimated effective reproduction number (Rt)2, 2nd order growth rates and confirmed infection density for most US counties (counties w/ > 0.03% confirmed infection density and > 1000 cases)
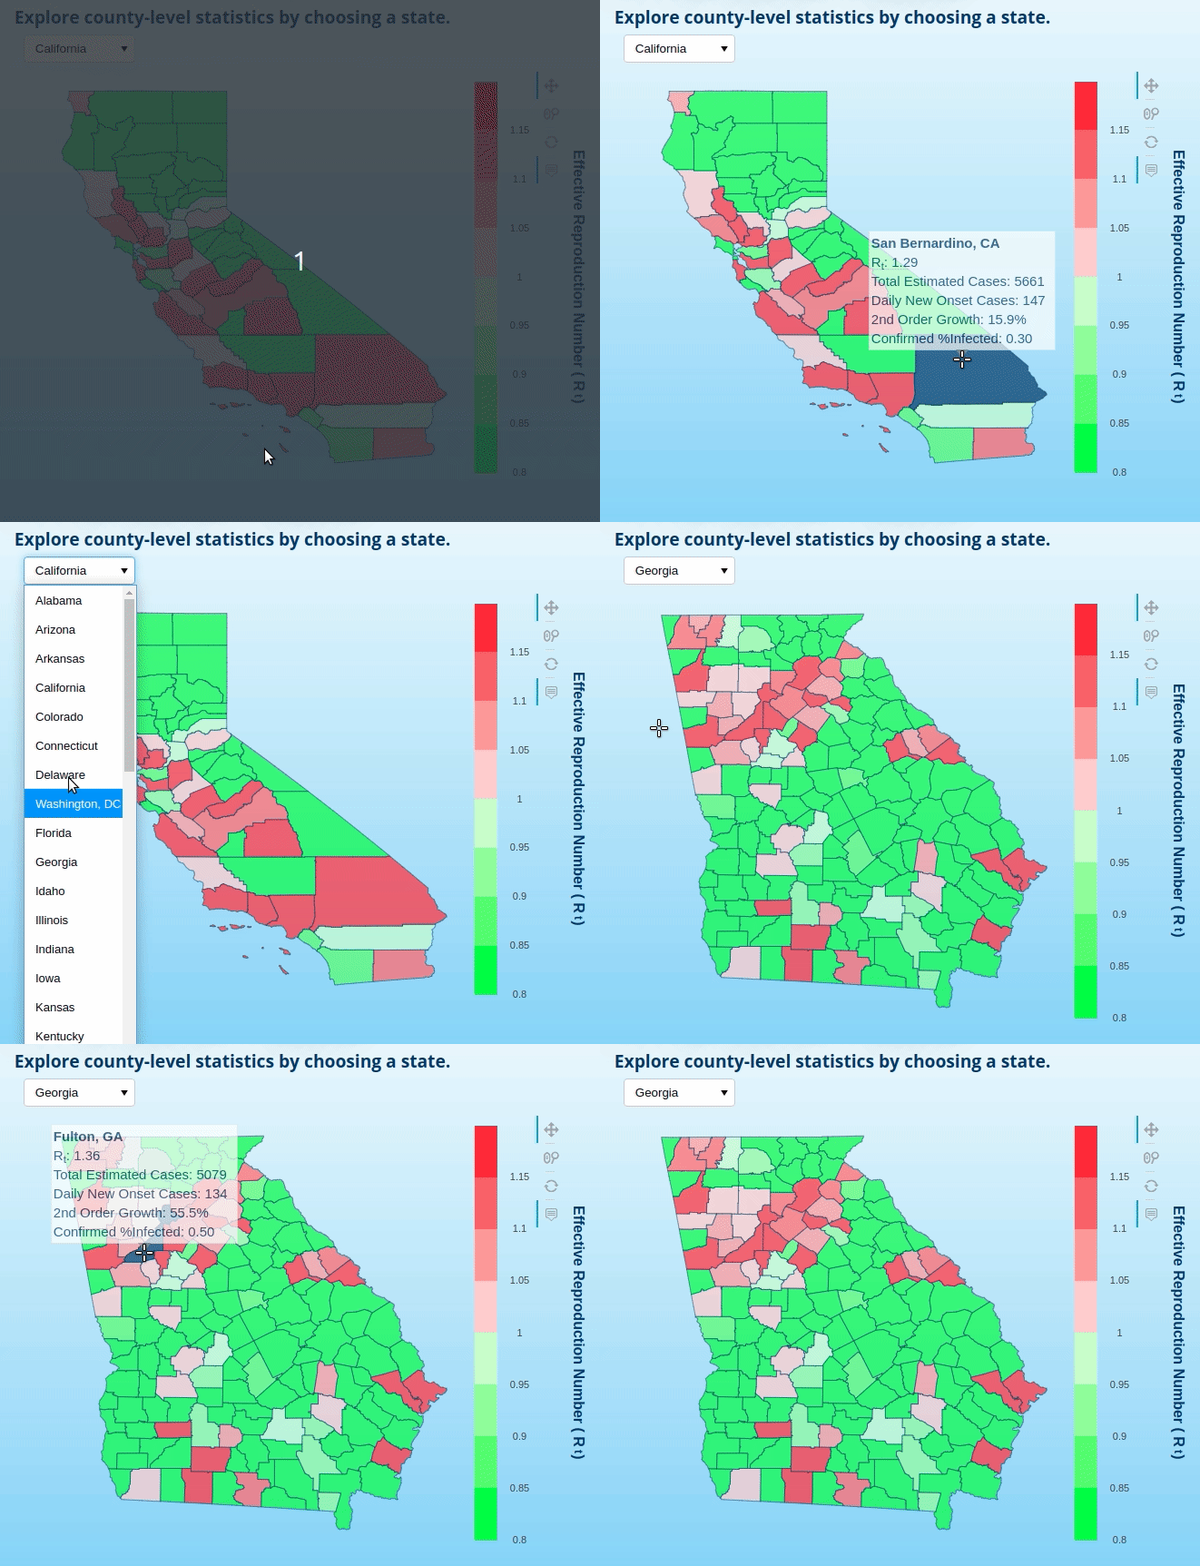
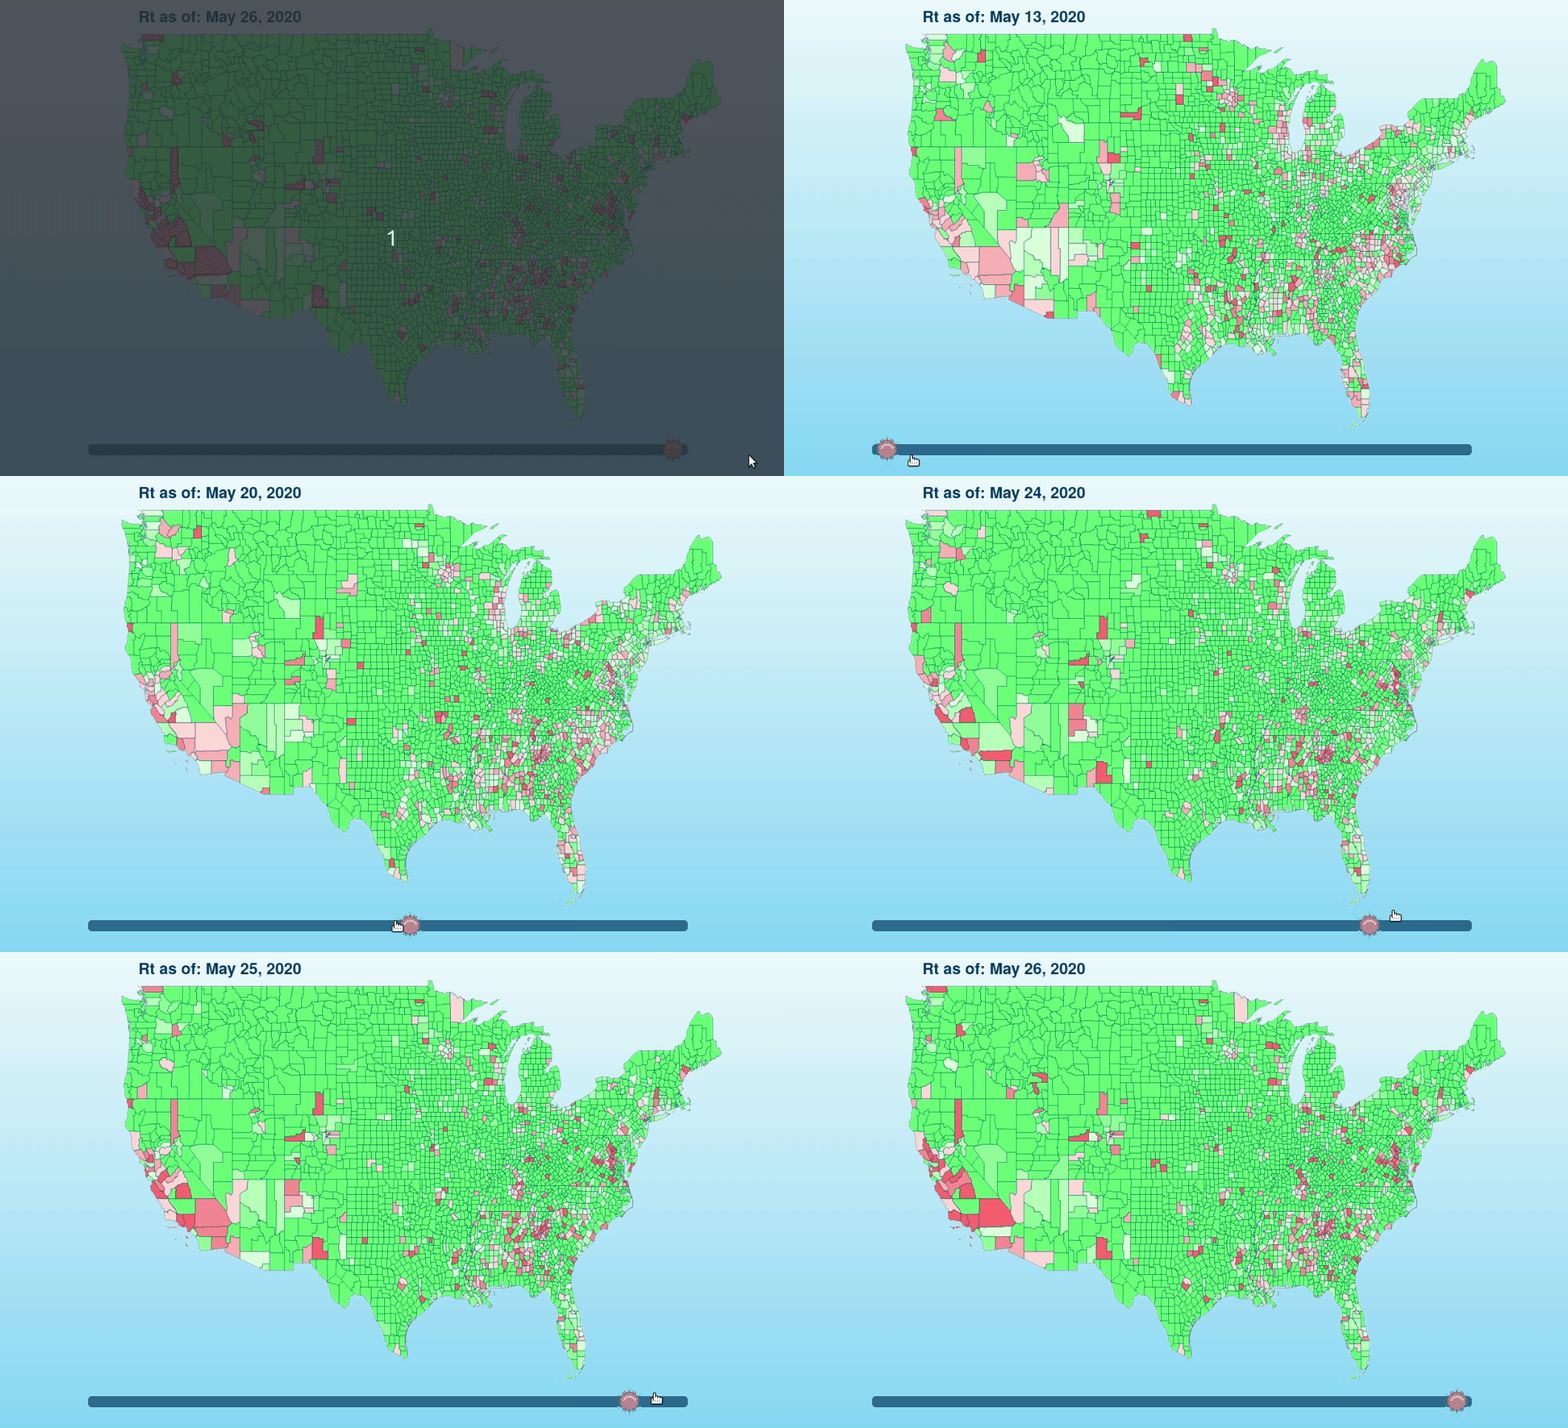
- State and national choropleths for exploring the geographic distribution of “real-time”1 county-level Rt2 along with other relevant epidemiological statistics. Due to resource constraints, the national choropleth represents exclusively Rt data while the state choropleths include additional county-level metrics. The national choropleth can currently be temporally evolved over a 14-day horizon.
- Notebook for manual EDA of county-level hotspot data
Daily Onset Estimation
- It’s important to be clear that these county-level Rt estimates are “real-time” in the sense that the approach outlined in (Bettencourt & Ribeiro, 2008) is used while convolving the latest onset-confirmed latency distribution onto daily reported cases (then adjusting for right-censoring) to obtain the estimated daily onset values. The latency between case onset and confirmation/reporting means that significant changes in local conditions still require some time (days) to be fully reflected in the Rt estimates, but the estimate for a given point in time should improve with each passing day to a degree roughly correlated with the aforementioned onset-delay distribution.
Effective Reproduction Number Estimation
- I’ve extended this great notebook to a county-level.
- Importantly, it should be noted that (as of 2020.05.12) access to testing is continuing to increase and test-positivity rates are therefore changing at a substantial rate. As the testing bias continues to evolve in the near-term, one should recognize that point Rt estimates will be biased to be higher than ground truth Rt. There are approaches that can mitigate this bias to a limited extent but fundamentally, we don’t have sufficient data to eliminate the bias at this point so I’ve deprioritized making those model adjustments at the moment (I may make testing-related adjustments in the future though and PRs are welcome!). Fortunately, as testing access and bias stabilize at a level that increases validity of confirmed case counts, these Rt estimates should become increasingly accurate. I think we can expect hotspot monitoring tools such as this to have utility for a number of months, so this initial period of testing volatility does not nullify their value.
- The most salient change I’ve made in the process of the extension is that rather than using a prior of gamma-distributed generation intervals to estimate R (which seems totally reasonable), I’m experimenting with incorporating more locally-relevant information by calculating an R0 using initial incidence data from each locality.
- For execution environments that are compute-constrained, I’ve also provided (but left disabled) some performance enhancing functions that cut execution time by about 50% at the cost of ~5% accuracy.
“Real-Time” State Choropleth

“Real-Time” County-Level Dashboard

“Real-Time” National Choropleth

License


